Professional Insights.
Explore the tools that help you visualize friction and clarify interactions.
Behavioral Heatmaps
The first and only macOS tool to bring high-fidelity heatmap tracking to your desktop. Uncover hidden friction in any application by visualizing where users struggle or engage most.

- Track movement density globally
- Per-task heatmap filtering with task markersPro
- Velocity heatmap (slow = reading, fast = scanning)Pro
- 3D heatmap with interactive SceneKit renderingPro
- Fade-over-time for long-running sessions
- Native Apple Silicon performance
Cursor Trail
Give your cursor a sense of motion with a customizable trail. Choose the length and color of the trail to suit your style and needs.

Click Pulses & Rage Detection
Provide clear visual feedback for every click with animated pulses. Automatically detect frustration through rage click patterns — rapid successive clicks that indicate confusion.
- Animated click pulses with customizable size and color
- Rage click detection (configurable threshold)Pro
- Click clustering with K-means analysisPro
- First-click analysis per taskPro
- Gaze plot (numbered sequential click visualization)Pro

Spotlight
ProSpotlight mode dims the background to highlight where your cursor is. Great for focused presentations and usability walkthroughs.

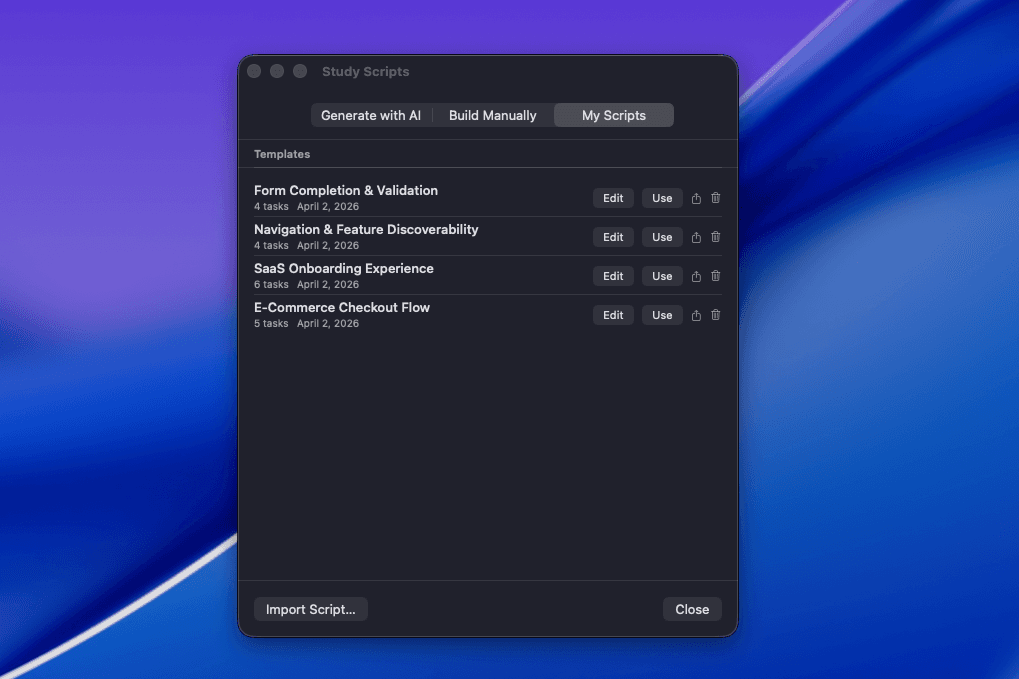
AI-Powered Study Scripts
ProDescribe your study in plain English and let AI generate a structured task script with success criteria. Reuse templates, share scripts as JSON, or import from other tools.
- Describe your study — AI generates tasks with timing estimates
- mouseviz:// schema for cross-tool interoperability
- 4 built-in templates (e-commerce, SaaS, navigation, forms)
- Save as reusable templates for repeat studies
- Import/export study scripts as JSON files
Floating Task Conductor
ProA compact sidebar guides your usability session through each task. Pass, fail, or skip tasks with a click — markers are created automatically. Add timestamped notes inline.
- 280px sidebar — minimal footprint, excluded from capture
- Pass/Fail/Skip buttons with auto-marker creation
- Per-task timer with estimated duration
- Inline notes tied to the current task
- Auto-success detection via foreground app matching or time limit
- Undo last task outcome if marked by mistake
- Post-task notes and task outcome summaries
- Keyboard shortcuts: ⌘⇧→ (pass), ⌘⇧↓ (skip), ⌘⇧N (note)

Session Metadata & Markers
Capture participant name, project, and tags before each recording. Drop task markers with ⌘⇧M or ⌘1-9 during recording. Group sessions by project in capture history.
- Optional pre-recording form (participant, project, tags)
- Quick markers: ⌘⇧M generic, ⌘1-9 numbered
- Quick notes: ⌘⇧N floating input overlay
- Live marker count in control bar timer
- Project grouping with folder toggle in history

Advanced Analysis Suite
ProGo beyond basic heatmaps. MouseViz includes analysis tools that professional UX researchers actually need — from hesitation detection to attention flow paths.
- Per-task heatmap filtering (select a task, see only its heatmap)
- Hesitation detection (cursor pauses > 2s)
- Attention flow paths (temporal color-coded movement sequence)
- First-click analysis with scatter metric
- Click clustering (K-means with auto-K selection)
- Scroll depth visualization with direction-change detection
- Transition matrix (cursor movement between screen regions)
- Areas of Interest (draw regions, get per-AOI metrics)
- Mouse velocity heatmap (slow = reading, fast = scanning)

Session Replay
ProPlay back any recorded session with the heatmap building up in real time. Scrub the timeline to jump to any moment. Marker pins on the timeline show task transitions.
- 60fps playback with progressive heatmap buildup
- Timeline scrubbing — drag to any timestamp
- Marker pins visible on the timeline
- Cursor dot follows the original path
- Space bar to play/pause

Session Comparison & Diffing
ProCompare two participants side-by-side or as a dual-color overlay (blue vs red). Compare design versions A vs B to measure if a redesign actually improved usability.
- Side-by-side and overlay comparison modes
- Per-task segment picker for focused comparison
- Multi-participant overlay (green = success, red = failure)
- Session diffing: green = less confusion, red = more
- Improvement score and hot zone shift metrics

Success Metrics Dashboard
ProAfter multiple sessions, see aggregated results across all participants. Task completion rates, time-on-task histograms, rage click correlation, and problem detection — all in one view.
- Overall completion ring and overview cards
- Per-task stacked bars (pass/fail/skip) with participant dots
- Time-on-task distribution histograms
- Rage click correlation per task
- Problem detection (> 30% failure rate auto-flagged)
- AI post-study insights with your configured provider
- Post-launch provider expansion is planned after v1.0.x

Built-in Video Editor
ProTrim, annotate, and export recordings without leaving MouseViz. Burn the heatmap directly onto the video for shareable clips that show exactly what happened.
- Trim with drag handles on the timeline
- Annotations: arrows, circles, rectangles, text labels
- 5 annotation colors with per-frame visibility
- Heatmap overlay compositing with adjustable opacity
- Speed control (0.5x, 1x, 2x)
- Session marker pins on the editing timeline
- Export as MP4 with all effects composited

Export Everything
ProExport your work in any format. From PNG heatmaps to interactive HTML reports, from CSV metrics to animated GIF timelapses — MouseViz has you covered.
- PDF reports (cover page, per-task heatmaps, notes, summary)
- Interactive HTML reports (dark theme, click-to-expand tasks)
- CSV export (task metrics, participant results, hesitations)
- Heatmap timelapse GIF (animated buildup)
- .mouseviz bundle (shareable study package with all artifacts)Team
- Video: H.264, HEVC, ProRes
- Images: PNG, JPEG, WebP (privacy blur for sensitive areas)
- Task notes and study outcome summaries

Automation Roadmap
TeamMouseViz starts with core deep links for launch. Shortcuts, Share Extension, team webhooks, and richer automation are planned after the v1.0.x direct-download release is stable.
- Available in v1.0.x: core mouseviz:// commands for recording and app navigation
- Planned: Apple Shortcuts actions for recording, markers, status, and export
- Planned: Share Extension import from Finder, Preview, Safari, and recording tools
- Planned: Slack and webhook notifications for study summaries
- Planned: Figma bridge, JSON-RPC IPC, CLI, and observer mode for teams

Floating Control Bar
Access all MouseViz features from a convenient floating bar. Toggle visualizations, add markers, open the task conductor, and manage recordings — all without switching apps.
- Record/Pause/Stop with live timer + marker count
- Mode toggles: Heatmap, Clicks, Trail, Spotlight
- Keystroke overlay during recordingPro
- 60 fps recording & high quality presetsPro
- Task marker button during recording
- Task script indicator when a study is loaded
- Three sizes: compact, regular, large
- Drag to reposition, follows cursor across screens

Settings
Customize every aspect of MouseViz to fit your workflow. From keyboard shortcuts to default save locations, output format preferences, and visualization defaults — make MouseViz truly yours.


Ready to unlock the full toolkit?
Start free, upgrade when you need unlimited recording and AI-powered analysis.
One-time purchase. $19.99 $9.99 launch price. 30-day money-back guarantee.